Strategic Assessment: Manufacturing
The following are among the primary problem areas SDI has assessed in manufacturing:
Strategic Topics
- Buffer size vs process variabilityprocess blocking & starving vs. cost of increased buffer size
- Capacity analysisability of current or anticipated capacity to handle projected product mix
- Operational strategiesimpact of new operational strategies on throughput and resource utilization
Buffer size vs. process variability
Summary
When processes operate in sequence, a natural question is "How closely 'coupled' should they be in order to obtain the highest production throughput?" If there is no buffer for accumulated product between them, then when one process fails, the adjacent one fails immediately. When there is a small amount of buffer, then when one process fails, the adjacent one fails...a little later. How does one quantify, in a real operation of both sequential and parallel operations, the trade-off between design rates, variability (in all its forms including reliability and scheduling rules), and of course, buffer (or conveyor) size? SDI has been answering these kinds of questions for 20 years using simulation modeling.
Pros & Cons
It often comes as a surprise that more buffer can result in more throughput. But more buffer (such as bigger in-process bins or longer conveyors) is increasingly expensive and harder to manage, and so at some point, there are diminishing returns. Just where these returns start to diminish is something that we can answer in a practical way using simulation.
In the context of scheduling, variability can be experienced in a "deterministic" (i.e., not random, but still dynamic) way. Depending on what products are being run and the equipment configuration, bottlenecks can "move" in an operation. If your operation experiences this, you know that the moving bottleneck is a product of demand, equipment sizing, reliability, and scheduling rules. Run too long on a given product, and the result is "bin lock" - product made too fast, resulting in an inability to package the product you want!
Example
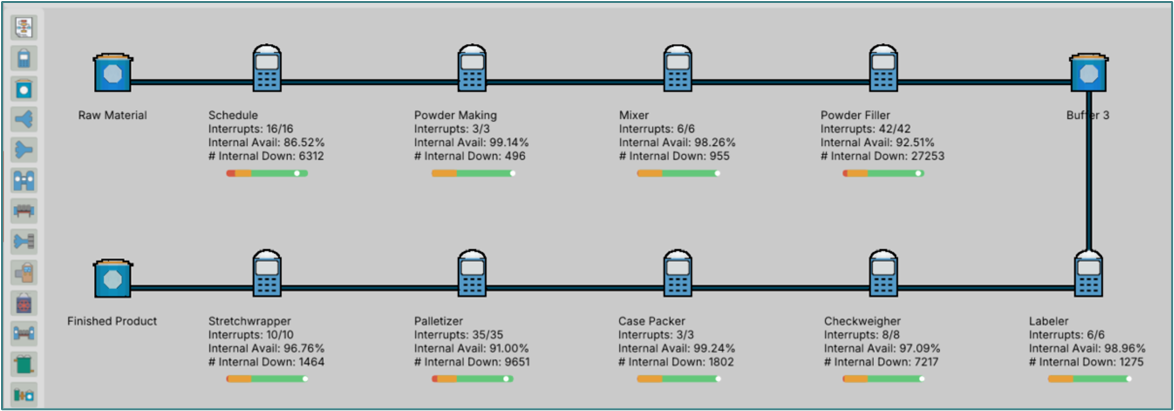
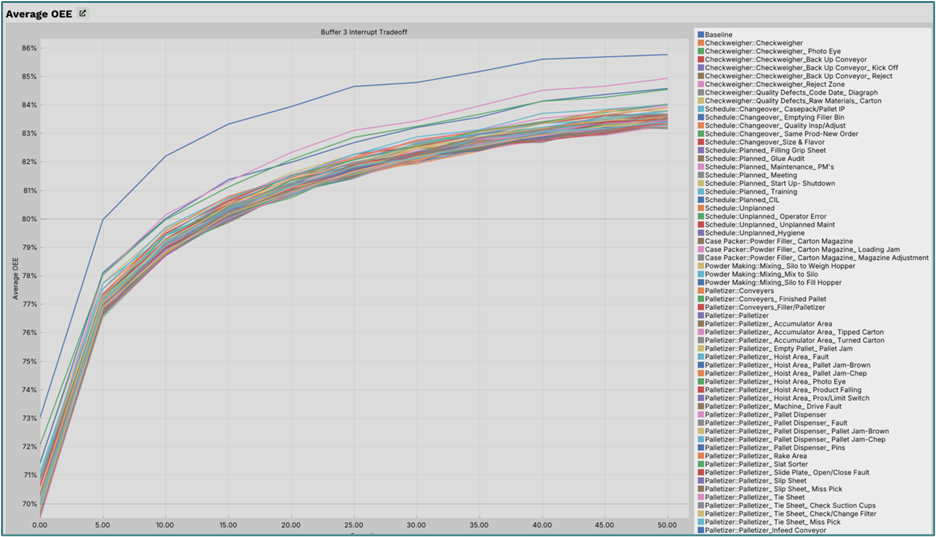
In the model above, "Buffer 3" on the top right corner represents the potential for in-process storage. The plot below shows results from a "Buffer Tradeoff" experiment where we vary the maximum capacity for storage in Buffer 3. The X-axis in the plot below represents different buffer size capacities that were used as experimental scenarios. At X=0, there is no buffer accumulation and it is just a pass-through node, resulting in the Powder Filler and Labeler being closely coupled. The Y-axis gives the Average OEE. The various plots represent different scenarios for the failures that are described as interrupts throughout the model. The "Baseline" plot (it's actually buried in there - the one hugging the lowest OEE. This represents when all as-is failures are enabled. The various other colored lines represent scenarios when that particular failure is disabled. The general trend among all plots is higher OEE, followed by diminishing returns. We can leverage these kinds of simulation experiments to determine whether to fix a failure, or increase a buffer capacity, and by how much.
Cases
For quality reasons, a coffee production plant was changing the production process, right in the middle - somewhere between roasting and grinding. That was critical, because heretofore, the roasting operation was always scheduled first, and then the packaging had to "jump through hoops" to get the product to the customer. Depending on the size of the product being packaged, the "slurp rate" (a modeling term) would cause in-process buffers to either drain too fast, or, problematically, too slow. What was needed was some way to evaluate the robustness of scheduling rules.
Through our practice, we were able to codify, explain, and experiment with the critical rules of this operation. The result was a profound change in the way this operation was understood and managed.
Capacity Analysis
Summary
Typical operations experience ongoing changes in capacity relative to demand. Customer demand and product mix changes over a time scale from days to years. Equipment investments are continuously made to seek improvements, such as greater efficiencies or higher product quality.
SDI helps those who are tasked with leading their operations to greater throughput and efficiency. We help you understand and quantify how your operation's current or anticipated capacity will handle projected demand. We can predict whether new investments will have benefit, even when operational complexity is high, due to:
- Many products
- Variability in process duration
- Equipment failures
- New processes where performance is untested or you are relying on vendor claims
- Many sequential or parallel steps
- Equipment/product relationships such as compatibilities and rate dependencies
- Competition for limited labor, jigs & fixtures, cleaning gear, and cooling equipment
- Limited (or costly) in-process storage availability
- Time lags between process phases.
SDI's simulations address the very real and very complex problems that people have in running operations. With one company alone, we developed and ran over 20 models of complex operations. In the cost avoidance area alone, the results are substantial.
Many customers have used models to realize that capital equipment they envisioned or ordered would have no incremental effect on their operation. In one case, no model was needed. After a meeting with SDI to discuss how a new operation would work, the operation leaders called to cancel all long-lead time equipment orders. Why? Because as we discussed how to model the envisioned system, we all realized it could not be effectively run. This is a case where the modeling process itself yielded enormous benefit. Due to the inherent through-time-fidelity nature of simulation, the specification cannot be fudged. The simulation must march, ever forward through time dealing with the consequences of realistic events. The model development process forces the modeler to ask questions, such as "What happens when this machine runs out of supplies or breaks?"
Proven Capacity Analysis Results
SDI's simulation models have consistently delivered measurable capacity improvements across diverse manufacturing environments:
- 15% throughput improvement achieved through scheduling optimization (Food Processing)
- 94% productivity improvement in automated warehousing through simulation-optimized design
- Better scheduling strategies replicated across 12+ similar facilities (CPG Manufacturing)
- Novel scheduling algorithms developed for complex "shifty bottleneck" problems
These results demonstrate how simulation reveals capacity opportunities that traditional analysis methods miss, including optimal strategies for overtime management, transfer of prebuild costs, and dynamic bottleneck resolution.
Cases
Operational Strategies
Case Study: Coffee Manufacturing Scheduling Transformation
When a quality initiative required inserting a new production stage into an existing Make-Store-Pack system for coffee production, the process change made it extremely challenging to create robust schedules using Advanced Planning Systems (APS). The system exhibited moving bottlenecks as a result of changes in packaging sizes.
SDI built a Make-Store-Pack simulation using our breakthrough Discrete Rate Simulation technology - the same innovation that originated from our Extend+Industry work and became part of ExtendSim's core libraries. DRS proved perfect for studying different scheduling and warehouse stocking policies under the new constraints.
This project showcased why SDI developed Discrete Rate Simulation in the first place. Traditional discrete event simulation couldn't effectively model the continuous flow nature of the "shifty bottleneck" problem. Our DRS technology, born from decades of manufacturing expertise, allowed the team to conceive, test, and verify an entirely new scheduling algorithm that proved robust across various demand scenarios.
Results: Successfully adapted plant operations to new production constraints and developed novel scheduling approaches.
Additional Examples:
- Chemical Manufacturing: SDI helped Rohm & Haas (Dow Chemical) evaluate alternative packaging line configurations and scheduling parameters, uncovering "additional options for low capital cost business growth, some of which were not readily apparent beforehand." — Rick Dougherty, Senior Manufacturing Analyst
- CPG Manufacturing: Developed better scheduling strategies that were replicated across 12+ similar facilities throughout the region.