Case Studies: Resource Management
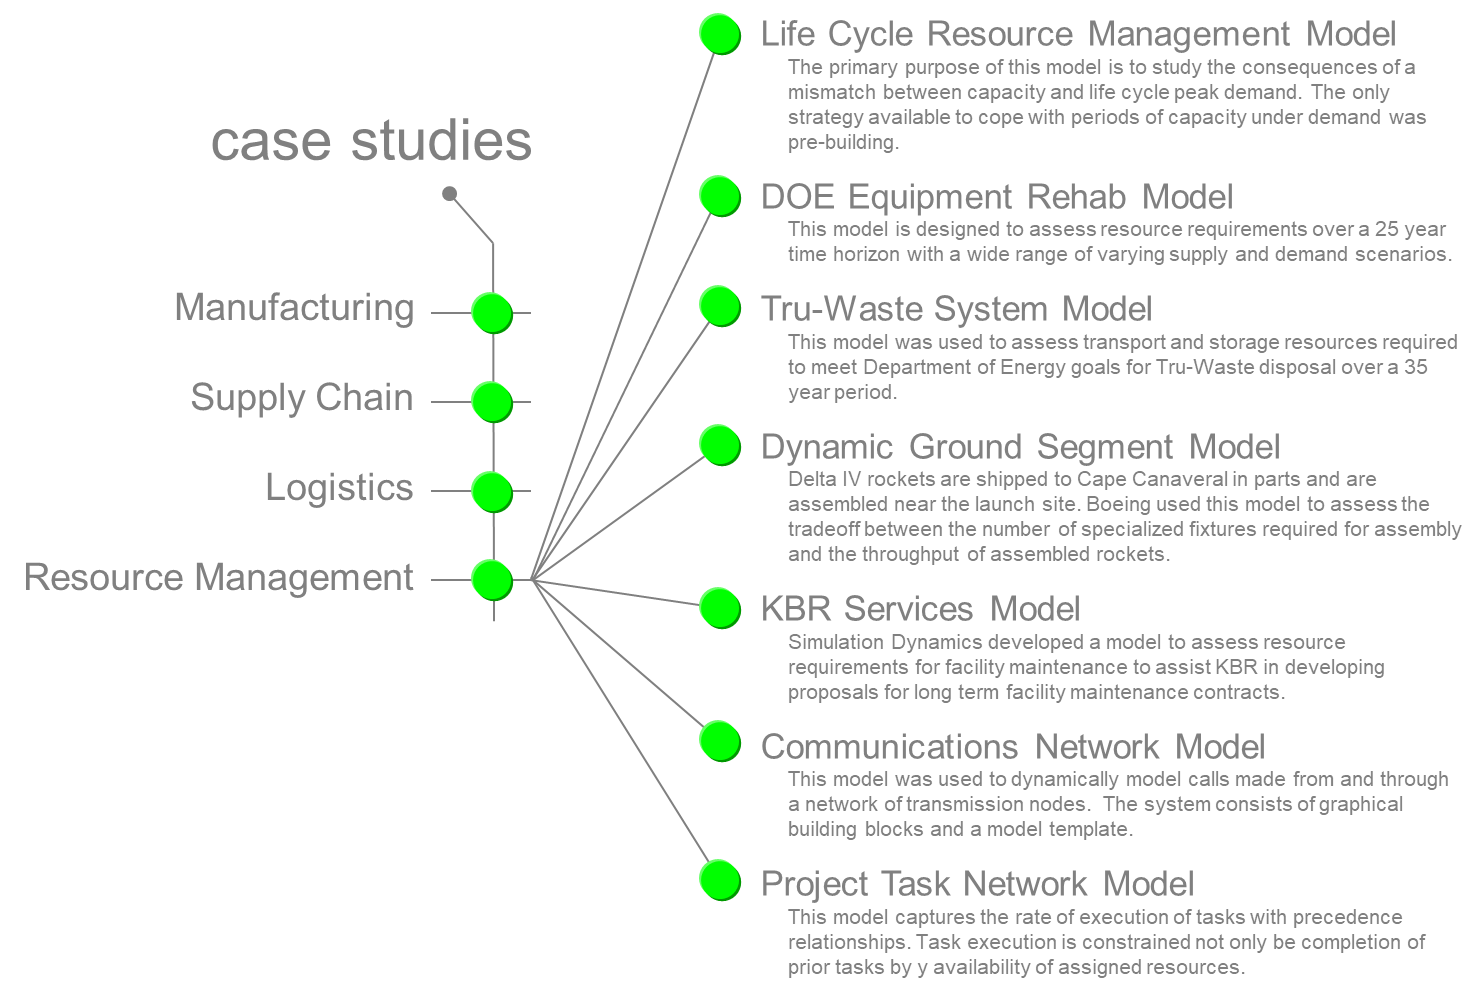
Case Study: Life Cycle Resource Management Model - use link
DOE Equipment Rehab Model
Summary
Background
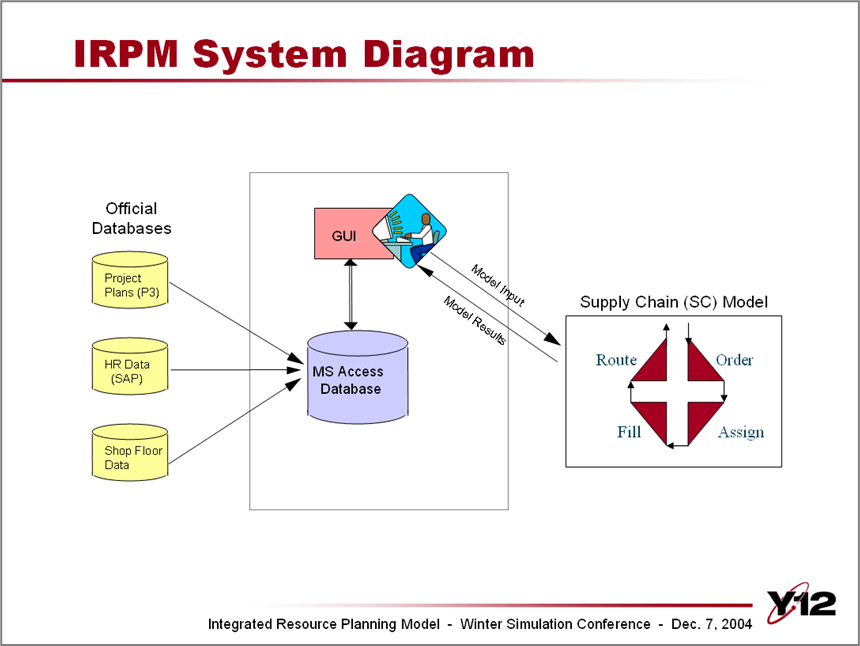
The National Nuclear Security Administration (NNSA) Y-12 National Security Complex is a manufacturing facility operated by BWXT Y-12. Y-12's missions include ensuring the US' nuclear weapons deterrent, storing nuclear materials, and fueling US naval reactors. In order to understand the impacts of these diverse missions on its numerous functional divisions, Y-12 has relied on simulation modeling.
Model Purpose
SDI developed a general purpose simulation model which allows Y-12 wide latitude in describing specific production scenarios through entries in database tables.
Key model inputs
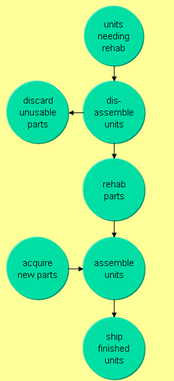
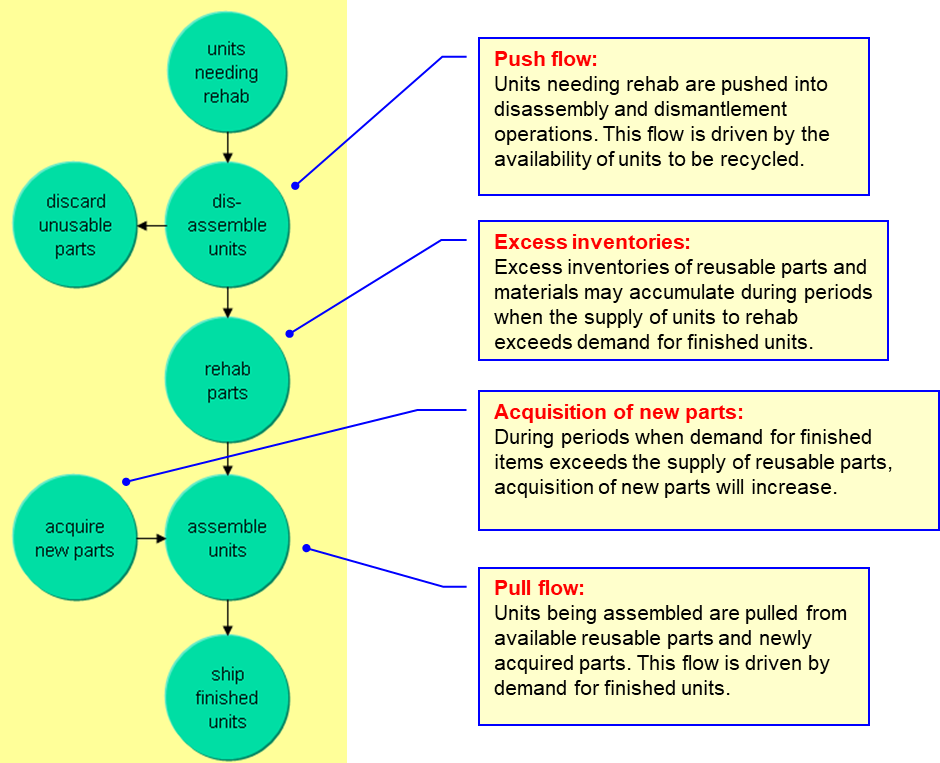
Nuclear weapons requiring rehab are forecasted as an input to the model. Components are sorted into discards, those requiring rehab, and those that can be reused as-is. Finished units are assembled from reusable, rehab and new components. Key inputs are:
- Component processing rates
- Production resource availability
- Percentage of components requiring rehab
Key Experiment Factors
- Resource scenarios
- Processing requirements scenarios
System Performance Measures
- On time delivery
- Resource Utilization
- Inventory levels
Key model issues
Model Database
Strategic Assessment
- Long Term resource management This model is designed to assess resource requirements over a 25-year horizon with a wide range of varying supply and demand scenarios.
Papers
A Supply Chain Paradigm to Model Business Processes at the Y-12 National Security Complex; Kress, R; Dixon, J.; Insalaco, T.; Rinehart, R., 2007 Winter Simulation Conference.
TRU Waste System Model
Summary
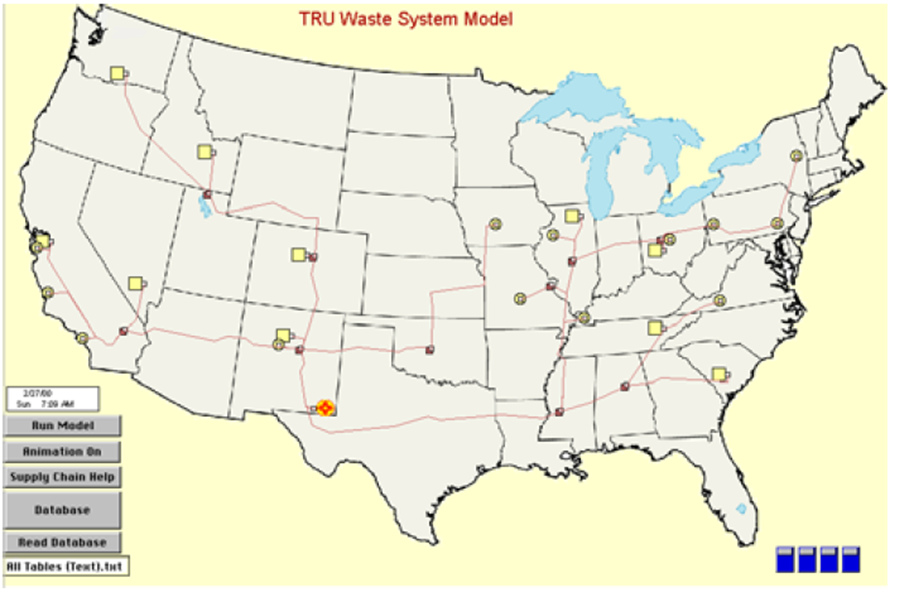
In response to the accelerated cleanup goals of the Department of Energy, Sandia National Laboratory (Sandia) has developed and utilized a number of simulation models to represent the processing, transportation, and disposal of radioactive waste. Sandia, in conjunction with Simulation Dynamics, has developed a supply chain model of the cradle to grave management of radioactive waste. Sandia has used this model to assist the Department of Energy in developing a cost effective, regulatory compliant and efficient approach to dispose of waste from 25 sites across the country over the next 35 years.
Paper
Simulation of Waste Processing, Transportation, and Disposal Operations; Janis Trone, Angela Guerin, Sandia National Labs; Amber Clay, Simulation Dynamics. 2000 Winter Simulation Conference.
Strategic Assessment
The following provides links to articles within this document that address strategic assessment issues related to this case study:
- Long term resource requirements This model was used to assess transport and storage resources required to meet Department of Energy goals for TRU-Waste disposal over a 35 year period.
Dynamic Ground Segment Model
Summary
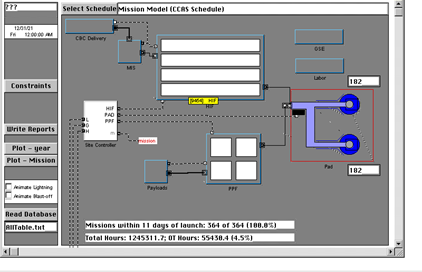
The DYNAMIC GROUND SEGMENT MODEL (DGSM) is a custom Extend model serving as a validation tool to establish that a planned Delta IV 20 year launch would meet minimum contract performance standards of 80% of launches within acceptable limits, including periodic unscheduled launches.
Background
During the final process for the selection of the company that would be contracted by the Department of Defense to launch a new generation of space vehicles, it was decided by one of the companies, to construct a high fidelity computer model to simulate all of the tasks that would be required in the launch vehicle ground assembly, pad erection and launch sequence. Each individual task would be comprised of the complete set of steps required for completion and the tasks would be performed in exactly the same order as would be followed for an actual launch. The objective was to provide validating proof that the planned tasks and execution sequence would ensure that at least a specified percent of all launches would fall within the specified launch window.
Model Output & Benefits
DGSM provided comprehensive custom report production with output direct to Excel report worksheets. Reports included Work Bay trace files of each task completion, regular and overtime labor reports by labor category and a comprehensive launch report showing the scheduled and actual launch date/time for each scheduled launch, including random extra launches.
Since the model design and layout permitted direct correlation and validation with actual launch sequence documentation, its performance and output established a reliable basis for demonstrating that the planned ground assembly and processing sequence would not only meet minimum contract performance requirements, but would in fact exceed minimum performance providing a a comfortable margin of safety to absorb unplanned launch schedule anomalies.
Strategic Assessment
The following provides links to articles within this document that address strategic assessment issues related to this case study:
- Long term resource requirements Delta IV rockets are shipped to Cape Canaveral in parts and are assembled near the launch site. Boeing used this model to assess the tradeoff between the number of specialized fixtures required for assembly and the throughput of assembled rockets.
KBR Services Model
Summary
Simulation Dynamics developed two tools to assist Brown and Root in preparing estimates for service contracts. A services contract simulation was developed to predict the level of service responsiveness and resource utilization that results from tasks required under the contract.
The second tool is an estimating database that supports the estimating process and provide information for proposal preparation, simulation and once a contract is awarded, provide initial information to the MP/2 system.
The simulation was developed in three steps: Version 1 included the programmed orders block which generates streams of task orders in accordance with a task order table. These orders are routed to task management blocks that operate according to task shift, overtime and completion requirements. Task response and completion performance are measured. A nominal resource constraint is included for preliminary testing.
Version 2 included labor and equipment constraints, including accounting for labor utilization on one, two or three shifts, and allocation of labor to weekend shifts.
The final version of the simulation incorporates cost parameters and reporting.
Strategic Assessment
The following provides links to articles within this document that address strategic assessment issues related to this case study:
- Long term resource requirements Simulation Dynamics developed a model to assess resource requirements for facility maintenance to assist KBR in developing proposals for long term facility maintenance contracts.
Communications Network Model
Summary
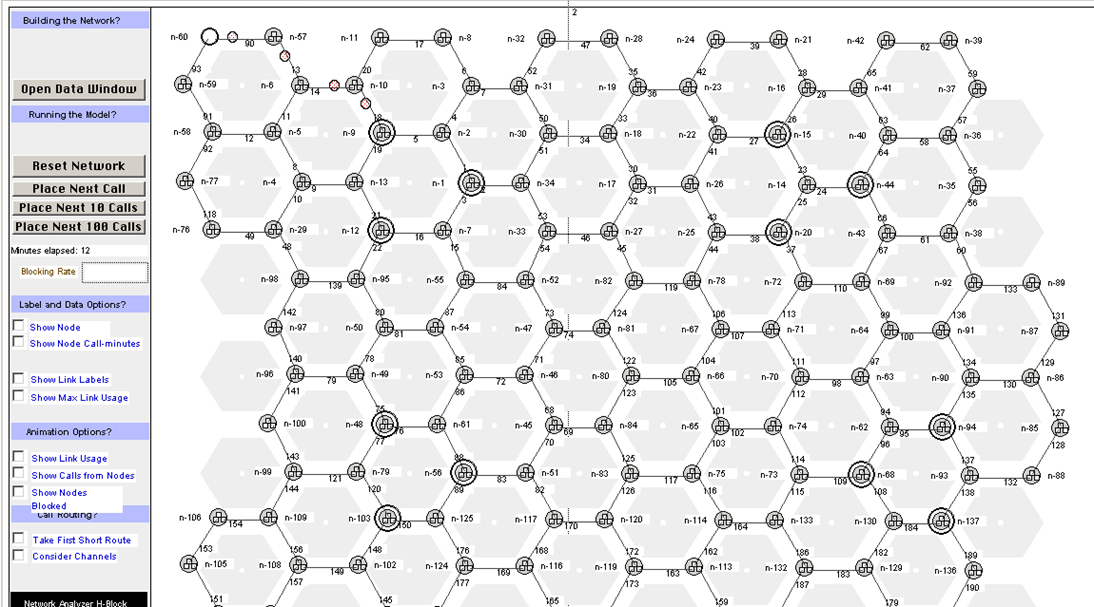
Simulation Dynamics has developed a network simulation used to dynamically model calls made from and through a network of nodes. The system consists of graphical building blocks and a model template. This system has been applied in a model used to study the feasibility of a business venture involving a new kind of cellular phone system. The model, pictured below, simulates the transmission of calls from any wireless "source" node through a network of other nodes, and to designated exit points, or POPs (Points of Presence). A POP is indicated in the model layout as a double circle. In this system, any node can place a call. The destination for a call is the nearest POP. POPs are connected to the wired network, which is outside this model's scope. To reach a POP, a call must be routed through other nodes via links from node to node. The purpose of the model is to understand the relationship among call patterns, network layout, channels and blocking rate.
Key Model Issues
Using the library of network component blocks which comes with the system, the user builds a network simulation by pulling graphical node blocks onto the screen, and connecting them together. In the model, any node can be connected to up to 3 other nodes. Any node can be defined as a POP. Following graphical model layout, a central analyzer block surveys blocks on the model, and builds a database of the relationships among nodes and links. The connections, or links drawn by the user, can be defined in the database to carry a limited number of calls. The database houses additional tables for input and output. For example, a Call Patterns table is provided for defining various patterns of call intervals and durations. Each node can be assigned a different call pattern. Once built, the entire database can be exported to another package, such as MS Excel or Access.
When the model is run, performance information is indicated on the graphical layout using text and colors. For example, a link which becomes increasingly busy will change in color from light blue to red. When a link becomes red, calls must be re-routed. In the database, a table stores run statistics such as each node's throughput in call-minutes, and each link's maximum channel utilization. The model also computes the overall blocking rate, defined as the number of blocked calls divided by the number of attempted calls.
During the model run, an algorithm is used to determine call routing. Whenever there is a change in the availability of a link, the minimum number of links from each node to a POP is calculated and stored in the database. When a call is placed from a node, the route to a POP is found by looking for a connected node which is one link closer to a POP. The route is then traced "downhill" from one node to the next until a POP is reached.
Options for the routing algorithm may be specified. In the "Take First Short Route" algorithm, the first available route is selected, regardless of the channels available. In the "Consider Channels" approach, if there are two equal routes, the one where the next link has the most channels available is taken. The first approach will fill up the channels of one route before switching to an alternative route of equal distance. The second approach spreads traffic among equal routes.
The network simulation architecture is founded on a system which is continuously developed to suit customer needs. The architecture is designed in a general fashion to support a wide class of problems. The system is supplied by Simulation Dynamics inclusive of training and the modeling of a selected network process. Models are easily transferred between Windows and Macintosh computers.
Strategic Assessment
The following provides links to articles within this document that address strategic assessment issues related to this case study:
- Network capacity This model was used to dynamically simulate calls made from and through a network of transmission nodes. The system consists of graphical building blocks and a model template.
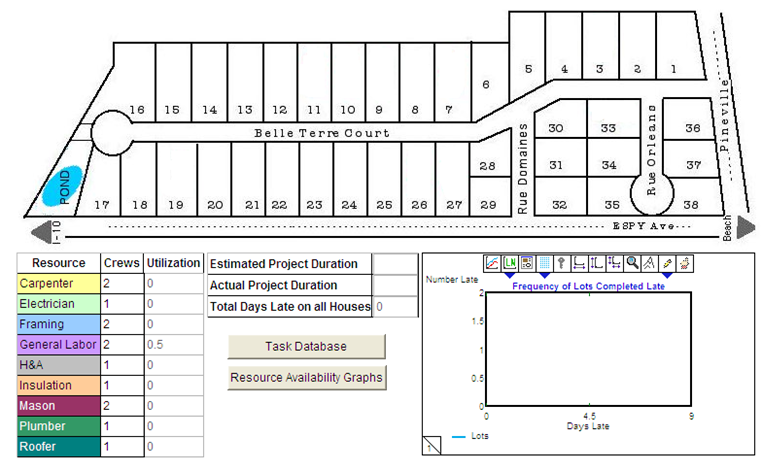
Project Task Network Model
Summary
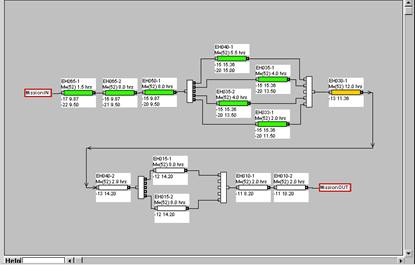
Project networks describe the interrelated tasks that make up a project. The purpose of representing tasks as a network is to clarify the precedence relationships among tasks, and allow for critical path analysis which determines early and late start and finish times for each task.
Tasks may compete for resources, introducing another source for delay in task and project completion.
In addition, multiple projects may take place within the same network. Now, rather than representing a project, the network represents the capability to execute projects. Simulation is an effective tool for analysis of work flow through such networks.
Key Model Issues
The key concept in representing task networks in SC Builder is the milestone. Each precedence relationship between tasks is represented by a milestone. Each milestone has a prior task and a following task. When a task is complete it generates one token for each precedence milestone for which it is the prior task. In order for a task to start, all prior milestones must be available. When they are, the task removes one token for each prior milestone. Once they have started, there are many alternatives for modeling task durations. If tasks require resources, they must grab them before their duration clock begins to tick.
Major issues may revolve around resources that are required for task groups. For example, in order to repair a car, a garage and a lift may be required. These resources are not grabbed by individual tasks but rather by the group. This suggests the ability to define a task hierarchy. An alternative approach to multi task resource assignments is to allow a task to grab but not release a resource. The resource would be released by a downstream task. This approach is fraught with the peril that a resource might never be released if it is not released by the task that grabbed it.
Strategic Assessment
The following provides links to articles within this document that address strategic assessment issues related to this case study:
- Network capacity This model captures the rate of execution of tasks with precedence relationships. Task execution is constrained not only be completion of prior tasks by y availability of assigned resources.