Case Studies: Supply Chain
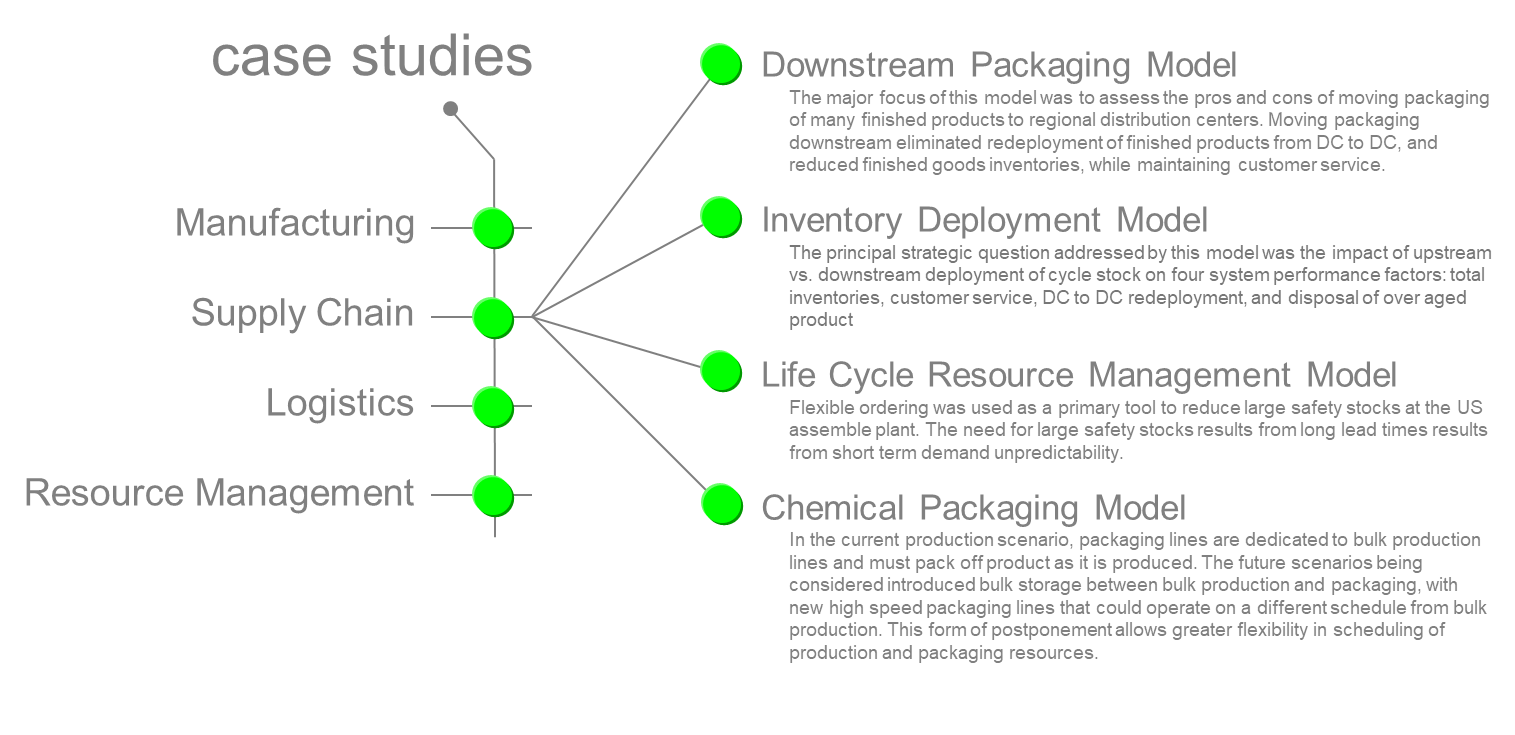
Downstream Packaging Model
Background
Simulation Dynamics built a simulation model for a U.S. manufacturer of consumer goods to support assessment of alternative inventory deployment and postponement options.
Model Purpose
To assess the pros and cons of moving selected packaging operations downstream to their major distribution centers.
Key model inputs
- Historical forecast and demand
- Production rates by system & product
Key Experiment Factors
- Reordering policy factors
- Categories of product to pack downstream
System Performance Measures
- Total inventories
- Customer order fill rate
- Redeployment cost
- Product disposal cost (aging)
Key Model Issues
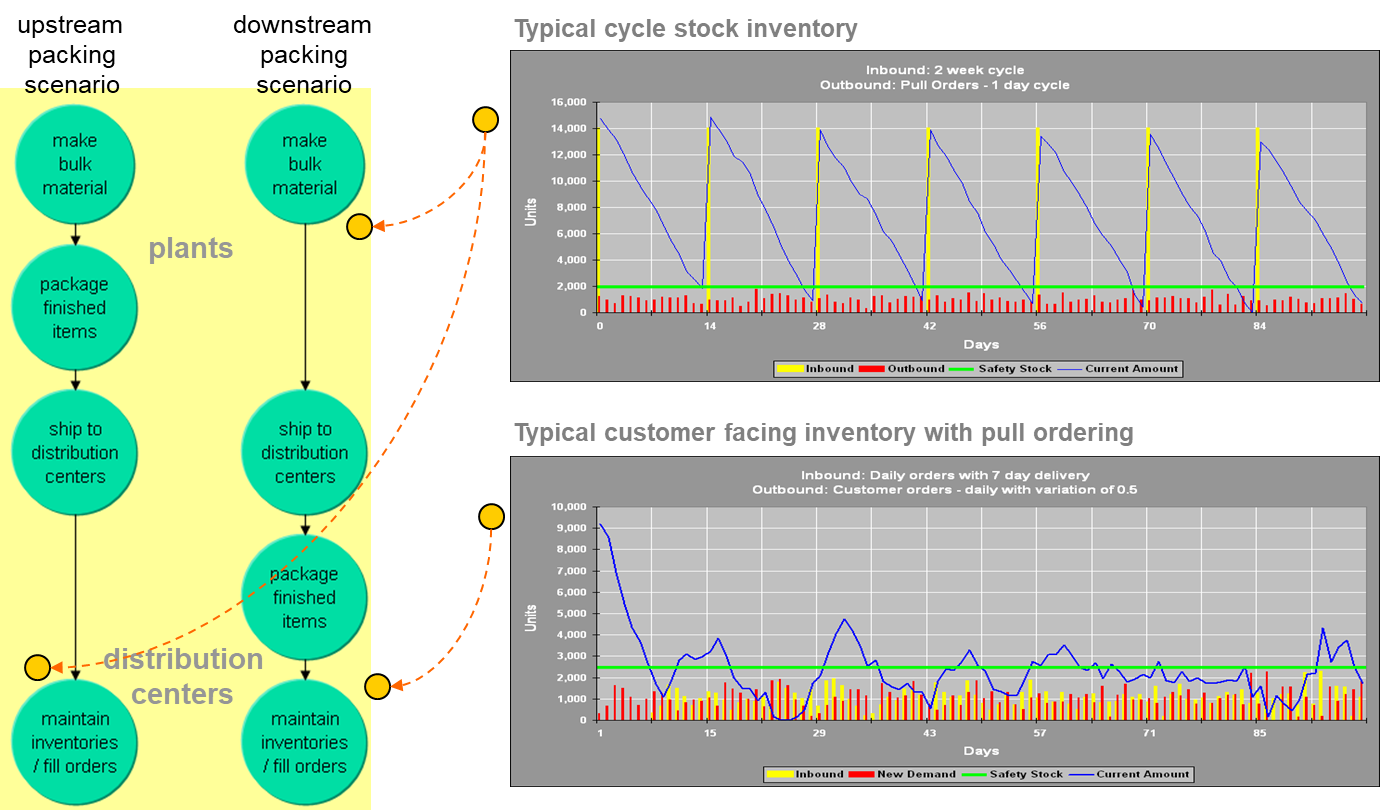
Production cycles of the bulk material at plants may be produced on cycles of 7, 14, 28 or as much as 91 days. When this product is packed at the plant, the result is substantial cycle stock of finished goods. Production runs are immediately allocated to packaging runs of finished items.
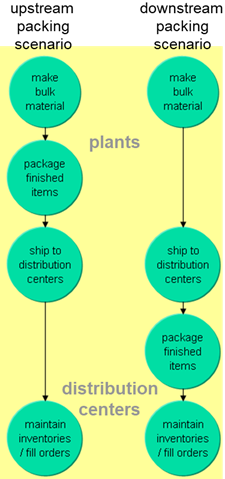
In the downstream packaging scenarios, bulk material is still produced on cycles of 7, 14, 28 or as much as 91 days. Each week, finished goods are packaged based on forecasted demand for the next week at that location. Production runs are held at plants until quantities are pulled to distribution centers for packaging. This approach virtually eliminates cycle stock of finished goods. In exchange, there are inventories of bulk material at each distribution center.
Simulation provided a clear picture of the advantages and disadvantages of downstream packing on a product by product basis.
| Upstream Packing Scenario | Downstream Packing Scenario | |
|---|---|---|
| Pros | No inventories of bulk material - it is converted into finished items at plants as it is produced. | Finished items are packed weekly at distribution centers, minimizing the effects of forecast error. Redeployment of stock between distribution centers is eliminated. |
| Cons | Bulk cycle stock allocated to finished items based on forecast. Substantial misallocation is possible. Finished item cycle stock allocated to distribution centers based on forecast. Misallocation leads to redeployment. | Inventories of bulk material is required at plants and distribution centers, potentially increasing overall inventory costs. |
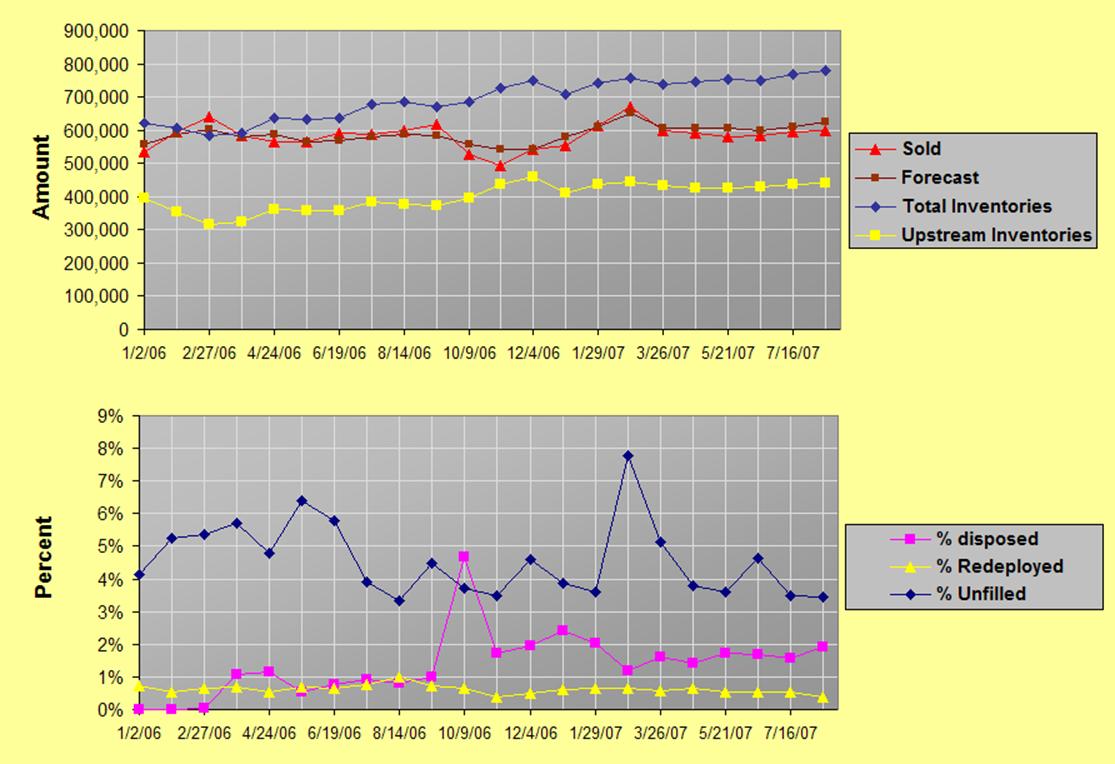
Plot of Network Activity
Strategic Assessment
The following list provides links to articles within this document that address strategic assessment issues related to this case study:
-
Postponement The major focus of this model was to assess the pros and cons of moving packaging of many finished products to regional distribution centers. Moving packaging downstream eliminated redeployment of finished products from DC to DC, and reduced finished goods inventories, while maintaining customer service. New bulk inventories at distribution centers and plants offset the above advantages for many product categories.
-
Safety Stock Design The baseline safety stock calculation, modified to account for fixed weekly downstream packaging schedules, accurately predicted safety stock requirements at customer facing inventories in this model.
-
A relatively minor issue in this case study was the question of where to deploy cycle stock of the bulk material shipped downstream for packaging. We concluded that it was most cost effective to keep all cycle stock upstream at the plants and fill orders from distribution centers on a pull order basis.
Inventory Deployment Model
Background
Simulation Dynamics built a simulation model for a U.S. manufacturer of consumer goods to support assessment of alternative inventory deployment options.
Model Purpose
To assess the pros and cons of holding cycle stock at plants versus pushing cycle stock downstream to distribution centers.
Key model inputs
- Historical forecast and demand
- Production rates by system & product
Key Experiment Factors
- Reordering policies
- Categories of product to push downstream
System Performance Measures
- Total inventories
- Finished goods inventories
- Bulk inventories
- Customer order fill rate
- Redeployment cost
- Product disposal cost (aging)
Key Model Issues
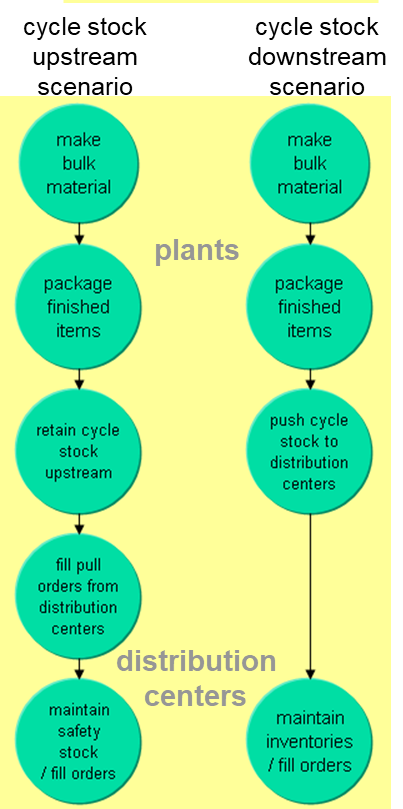
Production cycles of the bulk material at plants may be 7, 14, 28 or as much as 91 days. The result is substantial cycle stock of finished goods. In the downstream deployment scenarios, cycle stock is pushed to downstream distribution centers. In the upstream deployment scenario, cycle stock is held upstream until downstream inventories go below their order points and trigger pull orders. In some cases pushing cycle stock downstream results in 'early production triggers', since some downstream locations run out of product early and redeployment from other downstream locations is not feasible.
Simulation provided a clear picture of the advantages and disadvantages of deployment alternatives on an item by item basis.
| Cycle Stock Upstream | Cycle Stock Downstream | |
|---|---|---|
| Pros | Reduced redeployment for high variability products. Reduction of early production triggers. | Cycle stock pushed to distribution centers protects safety stock. |
| Cons | Safety stock at distribution centers is not supplemented by cycle stock, since cycle stock is not pushed downstream. | Misallocation of cycle stock to distribution centers results in redeployment and early production triggers. |
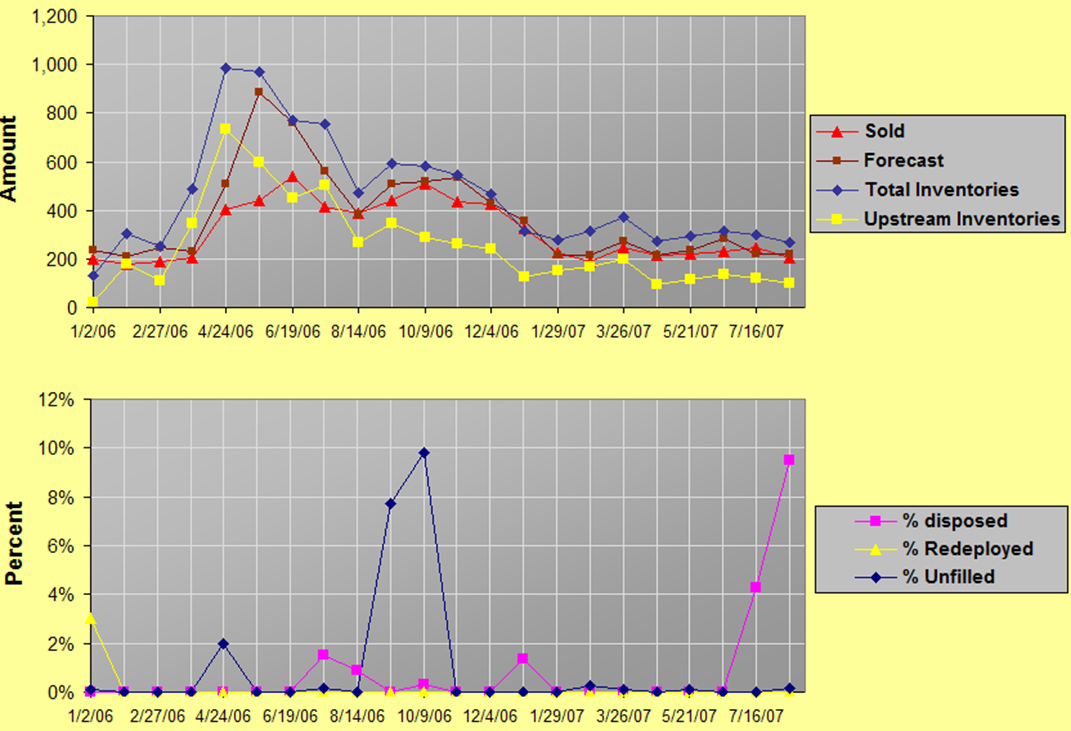
Plot of System Behavior
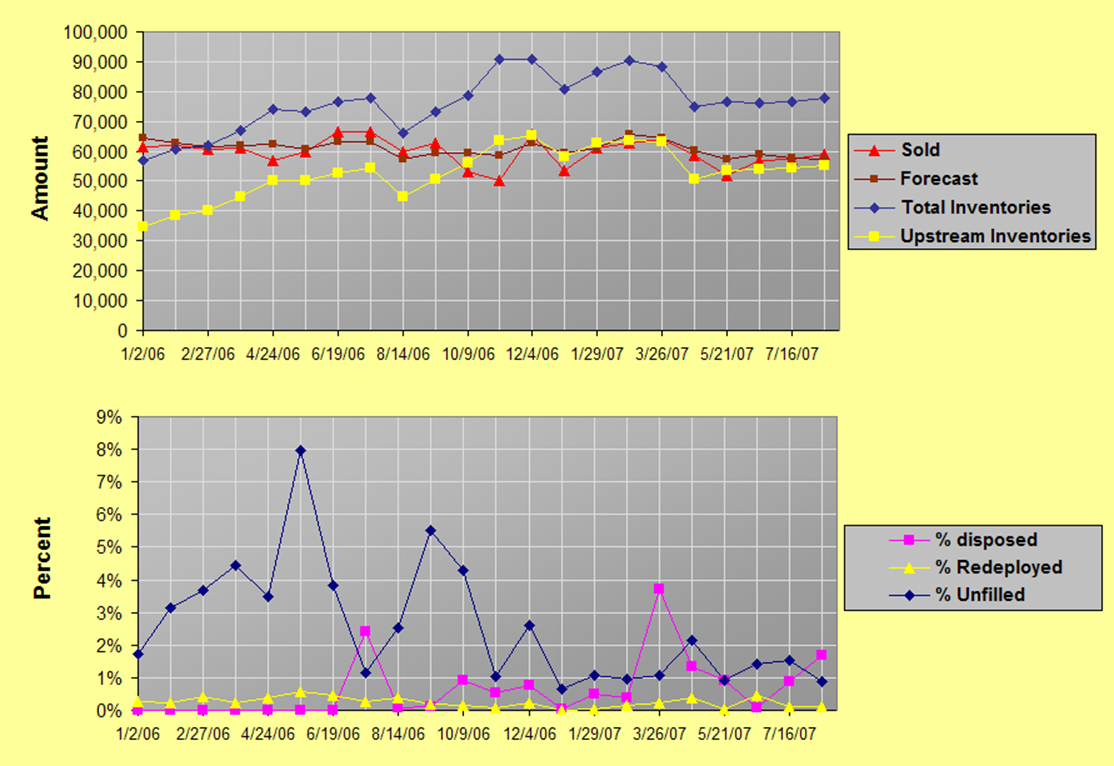
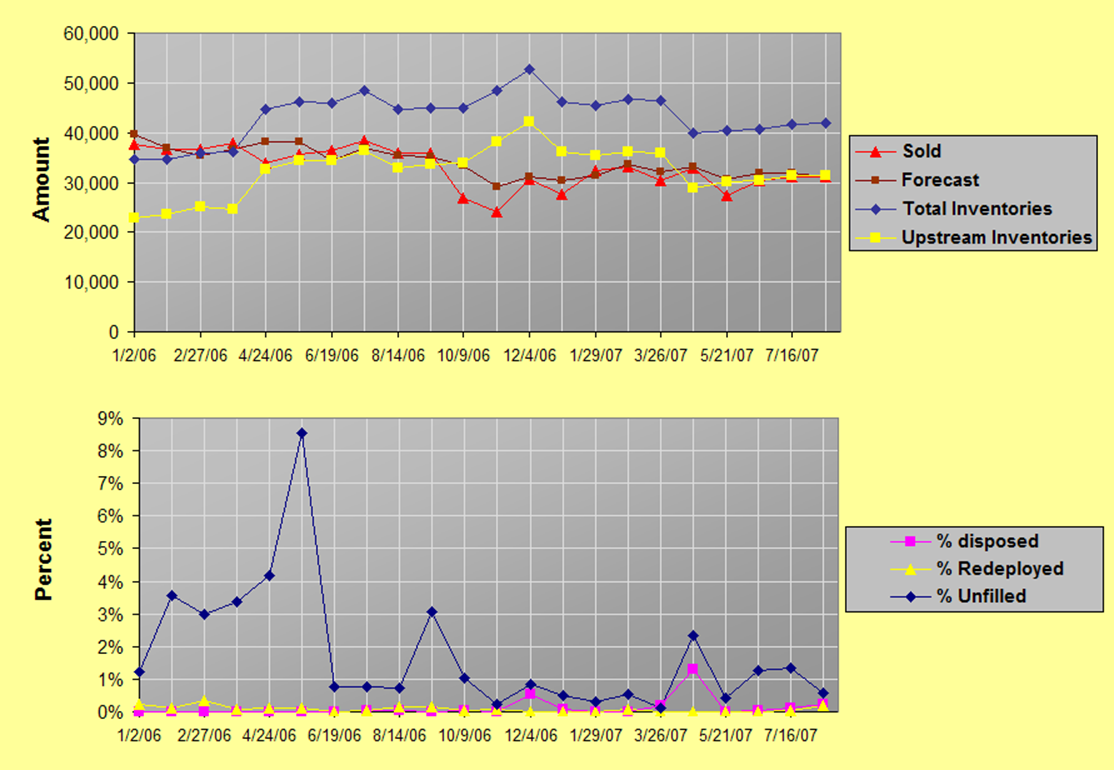
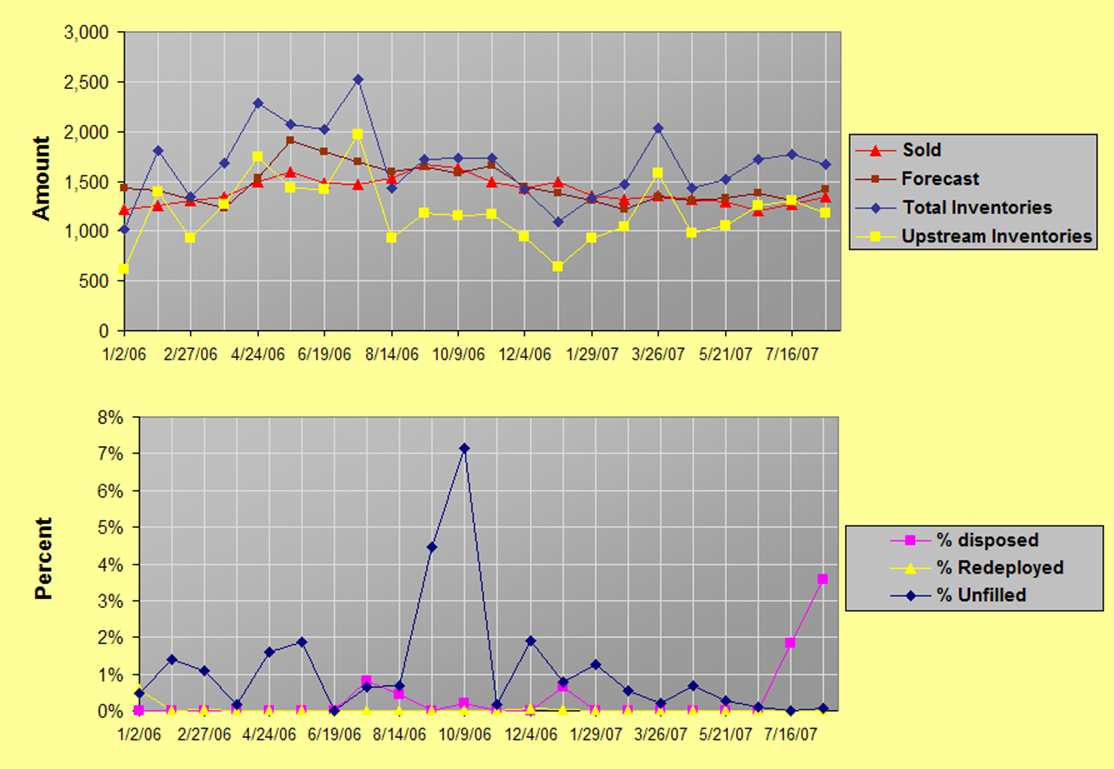
Simulation results can be plotted at any level of plant or product aggregation:
- All Plants All Products
 - 1 Plant All Products
 - 1 Plant 1 Category
 - 1 Plant 1 Brand
 - 1 Plant 1 Finished Product
Strategic Assessment
The following list provides links to articles within this document that address strategic assessment issues related to this case study:
-
A relatively minor issue in this case study was the question of where to deploy cycle stock of the bulk material shipped downstream for packaging. We concluded that it was most cost effective to keep all cycle stock upstream at the plants and fill orders from distribution centers on a pull order basis.
-
Safety Stock Design The baseline safety stock calculation, modified to account for fixed weekly downstream packaging schedules, accurately predicted safety stock requirements at customer facing inventories in this model.
-
In this model the first line of defense against plant capacity falling short of demand was transferring demand to another less efficient plant. If capacity system wide was under demand, prebuilds were scheduled.
Revolutionary Supply Chain Understanding - General Mills
Background
A major food manufacturer realized their conventional snapshot-based analysis methods were inadequate for understanding complex supply chain dynamics. They needed to see how their system actually behaved over time, not just at single points.
The Solution
SDI partnered with General Mills to create a dynamic simulation that could run six months of supply chain data in minutes, providing a "video" view of operations instead of static snapshots.
The Story
The real breakthrough came during model building itself. As one executive noted, the process "forced a certain diligence" in understanding system interconnections that they had never achieved before. The model became so fast and reliable that they could explore substantially more alternatives, leading to more thorough and novel solutions.
Industry Recognition
Featured in IIE Magazine (June 2001 IIE Solutions) highlighting the transformation from "snapshot" to "video" analysis capabilities:
If a picture is worth a thousand words, then the simulation of a complex supply chain must be worth a million. That's one of the conclusions General Mills drew after the company enhanced its conventional methods of analyzing supply chain cost savings with a simulation-based process offered through Simulation Dynamics.
The investment in Simulation Dynamics software has taken the guesswork out of analyzing supply chain scenarios and empowered General Mills with a more productive supply chain.
Project Results
Revolutionary change in analysis capabilities and decision-making speed. The model provided unprecedented insight into supply chain operations through dynamic rather than static analysis.
-
"Instead of taking a snapshot, this is more like a video. It's more than just a point solution. Your ability to actually see the activity in action and plot out the results allows you to understand impacts much better while the supply chain is running. We can run six months of supply chain data in a matter of minutes." - Mike Geddis, Director of Engineering, General Mills
-
"What we really found to be very powerful was the actual building of the model. It forced a certain diligence in terms of saying, if we change the system here this happens over here. We had not gone to that level of understanding the interconnections of our systems before."
-
"This definitely saves us time. It gives the ability to let the tools follow our questions and follow them rapidly, so once we have the model constructed, we can get results in as little as 15 minutes. There's no question we will explore substantially more alternatives than we would have if this were a more laborious process like before. As a result, we end up with much more thorough and novel solutions."
Strategic Understanding Transformation
Before Simulation Study: "If anyone here tells you they understand our supply chain, they are lying!" - Customer executive
After Model Development: The collaborative model-based consulting approach helped supply chain leaders visualize and understand complex network dynamics, transforming their strategic decision-making capabilities.
Strategic Assessment
The following list provides links to articles within this document that address strategic assessment issues related to this case study:
- Supply Chain Structure Understanding complex network dynamics and echelon impacts through dynamic rather than static analysis methods.
- Inventory Deployment Optimizing deployment strategies across the network using "video view" of operations instead of snapshots.
- Production Capacity Managing demand variability and capacity constraints with 15-minute scenario analysis capability.
Life Cycle Resource Management Model
Summary
Background
In collaboration with a manufacturer of electronics gear, SDI developed a simulation model to assess problems inherent in production of key components overseas.
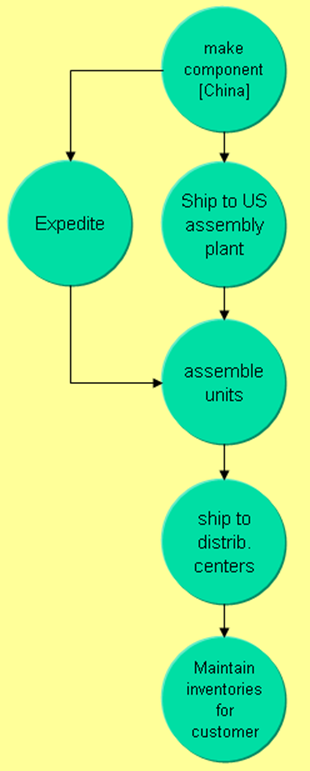
There is an allowance of 30 days for loading, transit and unloading, including customs.
Model Purpose
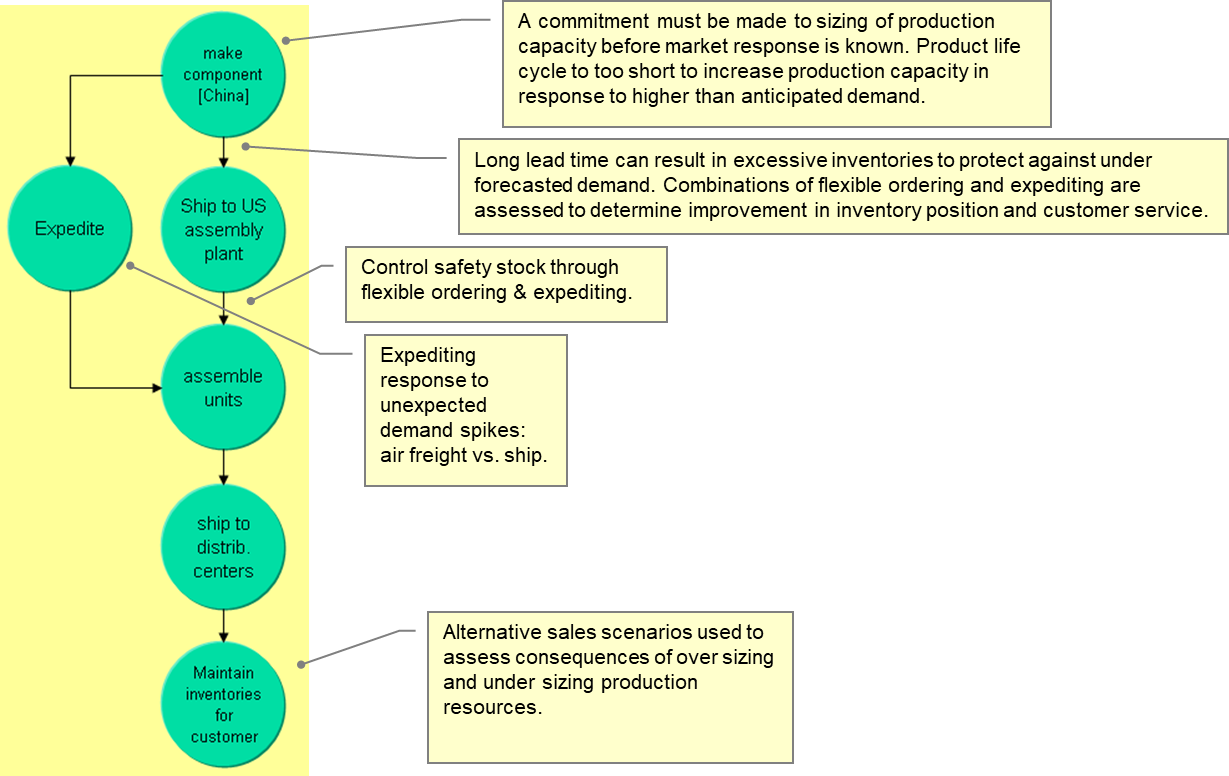
The model addressed three interrelated challenges:
- The difficulty of forecasting total and peak demand during the two year life cycle of a consumer electronics product line.
- The necessity of making capital commitments to production capacity in advance of production.
- The impact of long lead times (three to six months) on inventory management and customer order fill rate.
Key model inputs
- Life cycle demand and forecast combinations
Key Experiment Factors
Experiments were conducted to assess three strategic questions:
- What are the consequences of over forecasting and under forecasting at several levels of capital commitment to production?
- What are the potential advantages of using flexible ordering? What degree of flexibility strikes a balance between customer flexibility and supplier costs?
- What are the potential advantages of using expedited shipments.
System Performance Measures
- Capital equipment cost
- Cost of prebuilding inventory when and if peak demand is over capacity
- Total shipping cost
- Inventory requirements in China and at the US assembly plant
- Customer service
Key Model Issues
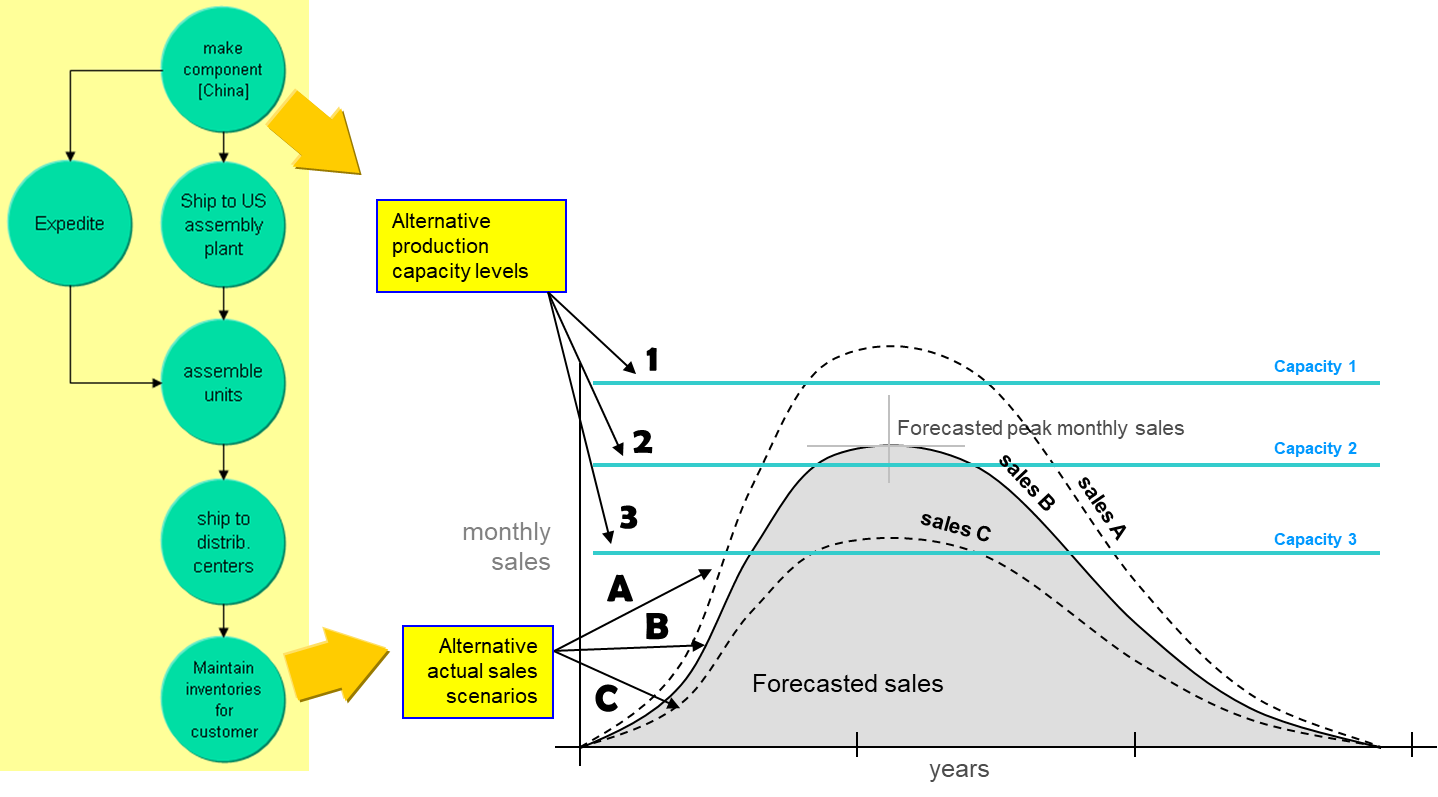
Actual Sales vs. Capacity
Simulation provided an assessment of the consequences of combinations of actual sales and capital investment.
| Actual Sales A (high) | Actual Sales B (medium) | Actual Sales C (low) | |
|---|---|---|---|
| Capacity 1 (high) | Moderate prebuild during peak period | No prebuild. Capital investment somewhat excessive | No prebuild. Capital investment very excessive |
| Capacity 2 (medium) | Massive prebuild during peak period | Moderate prebuild during peak period | No prebuild. Capital investment somewhat high. |
| Capacity 3 (low) | Capacity unable to keep pace with sales | Massive prebuild during peak period | Moderate prebuild during peak period |
Strategic Assessment
The following provides links to articles within this document that address strategic assessment issues related to this case study:
-
Life Cycle Resource Management
The primary purpose of this model is to study the consequences of a mismatch between capacity and life cycle peak demand.
-
The only strategy available to cope with periods of capacity under demand was pre-building.
-
Flexible Ordering Flexible ordering was used as a primary tool to reduce large safety stocks at the US assemble plant. The need for large safety stocks results from long lead times results from short term demand unpredictability.